
More than a third of Ottawa households rent. In the 2021 Census, 147,030 of the city’s 407,255 private households were renters, 36.1 percent, and 260,225 were owners. The citywide figure hides the real pattern: five central wards are majority-renter, the rural wards are under 10 percent renter, and nearly half of all renter households, 46.2 percent, live in those five central wards. RentSetGo Property Management publishes this page from the City of Ottawa’s Open Data census files, retrieved October 26, 2026. One warning before the numbers: this is 2021 Census data, and the shelter costs below are what tenant households reported paying in 2021. They are not current asking rents.
This page is the demand side of the Ottawa rental market. The supply side, what is being built and where, is tracked on our Ottawa housing pipeline page. What a specific home can charge today is a separate question, covered in our guide to how much rent you can charge in Ottawa. Read the two data pages together and a tension shows up: renters are concentrated downtown, while most new homes are being permitted in owner-majority suburbs. The ward tables below show the demand half of that picture.
How many Ottawa households rent?
147,030 households rent and 260,225 own, out of 407,255 private households citywide. Renters are 36.1 percent of households. The split comes from the Census long form, which is a 25 percent sample rather than a full count, so treat every figure here as a close estimate, not an exact registry. Statistics Canada also rounds census counts to multiples of five, which is why the 24 ward figures add up to within 10 households of the city total rather than matching it exactly.
The housing stock explains part of the split. Apartments of all forms, duplex units, low-rise and high-rise buildings together, make up 127,300 of Ottawa’s occupied dwellings, 31.3 percent. Single-detached houses are 41.7 percent and row houses 21.5 percent. Where a ward’s stock is mostly apartments, its renter share is high. Where it is mostly detached houses, owners dominate. The ward table further down shows how completely that pattern holds.
Which Ottawa wards are majority-renter?
Five wards, all central. Somerset (Ward 14) is first by a wide margin: 75.3 percent of its 25,130 households rent, 18,915 renter households, and 88.7 percent of its dwellings are apartments. Rideau-Vanier (Ward 12) follows at 72.7 percent, 18,005 renter households across neighbourhoods such as Vanier and Sandy Hill. Rideau-Rockcliffe (Ward 13) is 55.4 percent renter, Bay (Ward 7) 55.2 percent, and Capital (Ward 17), which includes the Glebe and the Golden Triangle, 52.1 percent. Between them the five wards hold 67,985 renter households.
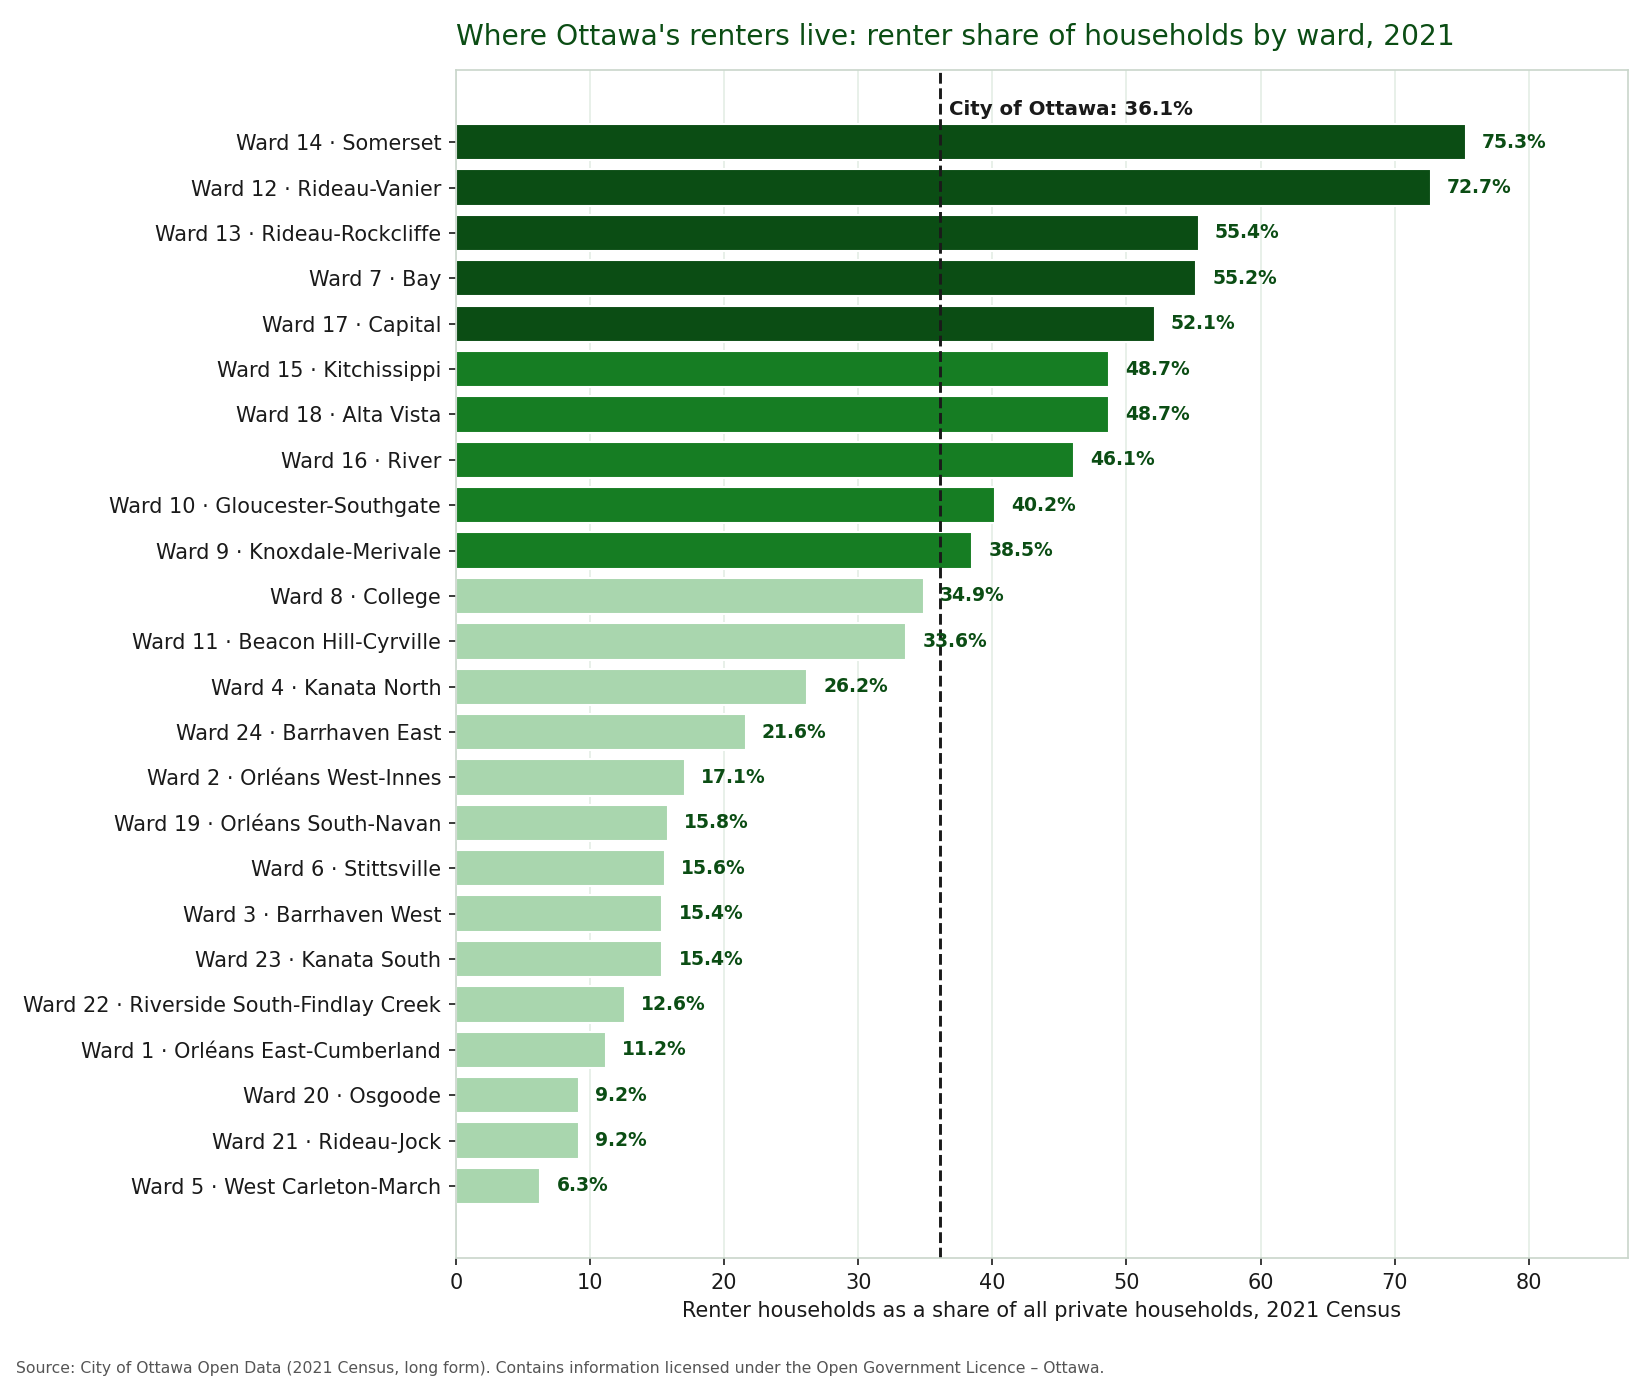
Renter share of households by ward, 2021 Census long form. Source: City of Ottawa Open Data, 2021 Long Form Census – Ward Data, retrieved October 26, 2026.
Just below the majority line sit two more established rental wards: Kitchissippi (Ward 15), which includes Westboro and Hintonburg, and Alta Vista (Ward 18), both at 48.7 percent. River (Ward 16) is 46.1 percent. At the other end of the table, West Carleton-March (Ward 5) is 6.3 percent renter, Osgoode (Ward 20) and Rideau-Jock (Ward 21) are 9.2 percent each, and Orléans East-Cumberland (Ward 1) is 11.2 percent. In those wards a rental listing is competing for a thin local tenant pool, and most tenants arrive from somewhere else.
All 24 Ottawa wards ranked by renter share
The full table, ranked by renter share. The shelter cost column is the median monthly shelter cost for rented dwellings in the 2021 Census. It describes the homes renters already occupied in 2021, and the next section explains why the highest figures sit in the suburbs.
| Rank | Ward | Households | Renter households | Renter share | Median monthly shelter cost, rented dwellings |
|---|---|---|---|---|---|
| 1 | Ward 14, Somerset | 25,130 | 18,915 | 75.3% | $1,320 |
| 2 | Ward 12, Rideau-Vanier | 24,775 | 18,005 | 72.7% | $1,200 |
| 3 | Ward 13, Rideau-Rockcliffe | 17,350 | 9,615 | 55.4% | $1,240 |
| 4 | Ward 7, Bay | 22,275 | 12,290 | 55.2% | $1,280 |
| 5 | Ward 17, Capital | 17,570 | 9,160 | 52.1% | $1,370 |
| 6 | Ward 15, Kitchissippi | 18,230 | 8,875 | 48.7% | $1,360 |
| 7 | Ward 18, Alta Vista | 18,715 | 9,115 | 48.7% | $1,250 |
| 8 | Ward 16, River | 19,630 | 9,045 | 46.1% | $1,200 |
| 9 | Ward 10, Gloucester-Southgate | 18,010 | 7,235 | 40.2% | $1,230 |
| 10 | Ward 9, Knoxdale-Merivale | 15,740 | 6,065 | 38.5% | $1,510 |
| 11 | Ward 8, College | 20,900 | 7,295 | 34.9% | $1,490 |
| 12 | Ward 11, Beacon Hill-Cyrville | 13,445 | 4,520 | 33.6% | $1,400 |
| 13 | Ward 4, Kanata North | 15,020 | 3,935 | 26.2% | $2,020 |
| 14 | Ward 24, Barrhaven East | 16,625 | 3,585 | 21.6% | $1,900 |
| 15 | Ward 2, Orléans West-Innes | 17,680 | 3,020 | 17.1% | $1,540 |
| 16 | Ward 19, Orléans South-Navan | 16,610 | 2,625 | 15.8% | $1,960 |
| 17 | Ward 6, Stittsville | 15,900 | 2,480 | 15.6% | $2,180 |
| 18 | Ward 3, Barrhaven West | 16,775 | 2,580 | 15.4% | $2,020 |
| 19 | Ward 23, Kanata South | 17,940 | 2,770 | 15.4% | $1,760 |
| 20 | Ward 22, Riverside South-Findlay Creek | 10,760 | 1,360 | 12.6% | $2,160 |
| 21 | Ward 1, Orléans East-Cumberland | 18,200 | 2,040 | 11.2% | $1,700 |
| 22 | Ward 20, Osgoode | 10,815 | 995 | 9.2% | $1,250 |
| 23 | Ward 21, Rideau-Jock | 10,045 | 925 | 9.2% | $1,220 |
| 24 | Ward 5, West Carleton-March | 9,105 | 570 | 6.3% | $1,210 |
What do Ottawa renters pay? Census shelter costs by ward
The citywide median monthly shelter cost for rented dwellings was $1,380 in the 2021 Census, and the average was $1,422. Owners reported a median of $1,560. Shelter cost is the household’s total monthly cost of the dwelling: rent plus electricity, heat, water and municipal services where the household pays them. It is a cost measure for occupied homes in 2021, not a rent roll and not an asking rent.
The ward range runs from $1,200 in Rideau-Vanier to $2,180 in Stittsville, and the order surprises most readers. The lowest medians are in the renter-heavy core: Rideau-Vanier and River at $1,200, Gloucester-Southgate at $1,230, Rideau-Rockcliffe at $1,240, Alta Vista at $1,250. The highest are in newer suburbs: Stittsville at $2,180, Riverside South-Findlay Creek at $2,160, Kanata North and Barrhaven West at $2,020 each, Orléans South-Navan at $1,960. The reason is the stock. Suburban rentals are mostly newer, larger houses and townhouses. Core rentals are mostly older apartment units, smaller and cheaper per month even in buildings where a new lease signs well above the ward median.
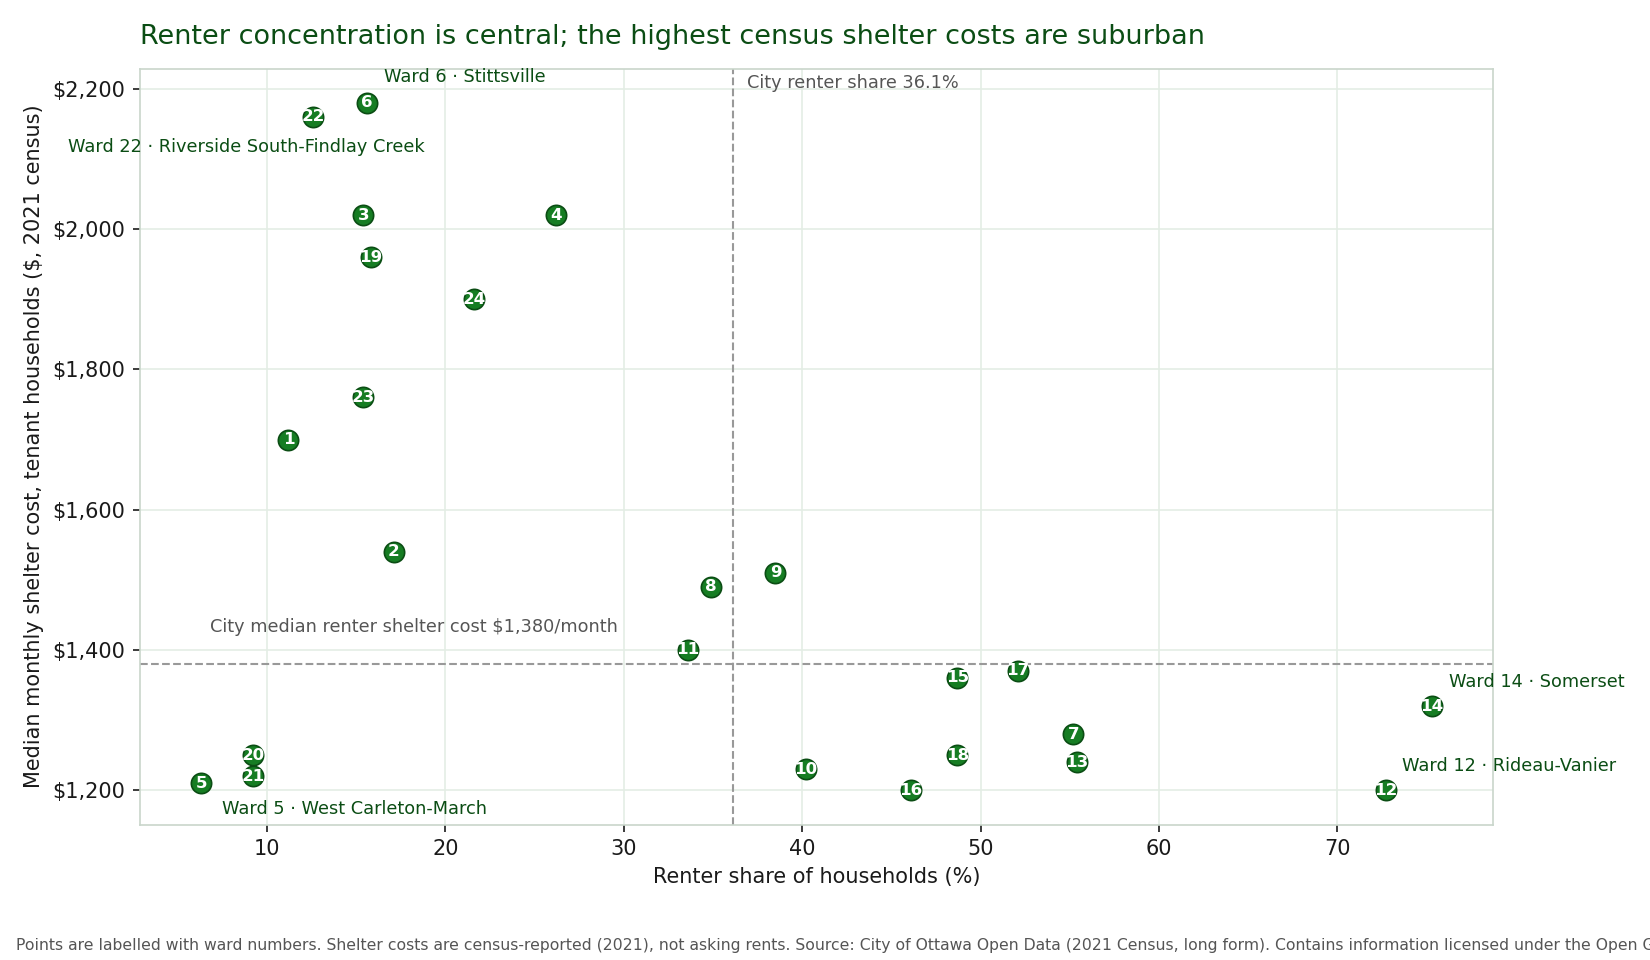
Renter share vs median renter shelter cost by ward, 2021 Census long form. Shelter costs are census-reported costs for occupied homes in 2021, not asking rents. Source: City of Ottawa Open Data, retrieved October 26, 2026.
Affordability pressure sits underneath these figures. In 2021, 35.1 percent of Ottawa tenant households spent 30 percent or more of their income on shelter costs, and 23.3 percent were in core housing need, the federal measure that combines affordability, suitability and state of repair. Those are citywide rates across all tenant households, and they set the ceiling context for any rent decision: a large share of the tenant pool was already at or past the standard affordability threshold five years ago.
What this data can’t tell you
Four limits matter. First, the data is from May 2021. It pre-dates the 2023 to 2026 supply wave entirely, so it shows where renters lived before thousands of new units were permitted, not where they live now. Second, census shelter costs are not asking rents. They average every occupied rental home in a ward, including long-held tenancies paying well below market, and they include utilities for many households. Pricing a unit off these medians would underprice most homes. Third, the tenure split exists only in the long form, a 25 percent sample. The City’s short form ward file has no tenure rows at all, so there is no full-count version of this table. Fourth, the ward names and numbers are the 2022 to 2026 ward set. Ottawa’s ward boundaries change with the October 2026 election, the file does not name its boundary vintage, and the City expects updated ward census data in 2028, after the 2026 Census. One smaller note: the shelter cost rows cover tenant households in non-farm, non-reserve private dwellings, 146,985 households citywide against 147,030 renter households in the tenure table. The gap is the subset definition, not missing data.
Where renters are vs where new homes are landing
The figures in this section pair the 2021 Census ward table with the permit figures from our Ottawa housing pipeline page, net new dwellings permitted from January to September 2026. The comparison is our interpretation, labelled as such, because the two series measure different things in different years: the census counts who rented in 2021, and permits count homes, with no record of whether they will be rented or owned.
The mismatch is plain. The four biggest permit wards of 2026 are Orléans South-Navan (928 net units, 15.8 percent renters in 2021), Barrhaven West (787 units, 15.4 percent), Kanata North (751 units, 26.2 percent) and Stittsville (661 units, 15.6 percent). Most of the city’s new housing supply is landing where renting was a minority tenure. Somerset is the exception that proves the pattern: the ward with the highest renter share in the city, 75.3 percent, also took 709 net permitted units in the same nine months, so new lease-up competition concentrates there too. Capital ward sits at the opposite extreme, 52.1 percent renter and only 18 net units permitted, an established rental ward adding almost nothing. Growth in the suburbs is what our Orléans, Barrhaven and Kanata management pages watch, because today’s suburban completions become tomorrow’s rental listings whether or not they were built for that purpose. Two companion pages track the supply side in more detail: Ottawa secondary suites counts the suites being added inside existing homes, and Ottawa development applications tracks what is entering the planning system.
What This Means if You Own a Rental in Ottawa
The figures above are measurements. What follows is our reading of them for Ottawa landlords, labelled as interpretation throughout.
Renter demand in the core is structural, not cyclical
Five wards hold 67,985 renter households, 46.2 percent of all renters in the city, and renting is the majority tenure in each of them. In our reading, tenant demand in Somerset, Rideau-Vanier, Rideau-Rockcliffe, Bay and Capital does not depend on new supply arriving or on any one employer or school. It is built into the housing stock: Somerset’s dwellings are 88.7 percent apartments and Rideau-Vanier’s are 81.6 percent. Owners there are marketing into the deepest tenant pool in the city.
Suburban rentals are scarce stock, priced like it
Stittsville has 2,480 renter households and a median renter shelter cost of $2,180, the city’s highest. Riverside South-Findlay Creek has 1,360 renter households at a $2,160 median. Where rentals are a small share of a suburb’s homes, each listing faces few direct comparables and the homes themselves are larger. We read that as a scarcity position, with a catch: the tenant pool is thin, so a mispriced suburban rental can sit while a core unit at the same rent would lease. Scarcity rewards accurate pricing, not optimistic pricing.
Affordability is the binding constraint where renters concentrate
Citywide, 35.1 percent of tenant households were at or over the 30 percent shelter-cost threshold in 2021, and 23.3 percent were in core housing need. In renter-heavy wards the pattern holds: Rideau-Vanier recorded 38.7 percent of tenant households at or over the threshold, Capital 38.6 percent, Bay 35.7 percent. For a landlord, that is the practical limit on rent growth in the wards with the deepest demand. The pool is large, but a large share of it is already stretched, which shows up as longer searches and more failed applications when a unit is priced past the pool.
Do not price off census shelter costs
The $1,380 citywide median is a 2021 figure for occupied homes, weighted toward long-held tenancies. Current pricing needs current evidence: comparable signed leases and live listings for the same unit type in the same area. Our guide to how much rent you can charge in Ottawa works through that method. Use this page’s figures for what they are good at, deciding which wards have deep tenant pools and what kind of stock a property competes with, and use market data for the number on the lease.
When this is a watch item, not an action item
If your property is tenanted on a stable lease, nothing in this table asks you to act. The ward data matters at decision points: buying in a ward where renters are 6 percent of households means underwriting a thin tenant pool, and renewing or re-leasing in Somerset means pricing against both the city’s deepest demand and 709 newly permitted units nearby. Plenty of owners run those decisions themselves with the census and permits files, which are free. Where our property management service earns its fee is the same work done per property: pricing against the local pool and the local supply, then leasing and managing from there.
The Bottom Line
Ottawa renting is concentrated. Renters are 36.1 percent of the city’s households, but five central wards hold 46.2 percent of them, and the rural wards barely reach one household in ten. Census shelter costs run highest where renters are scarcest, because the suburban rental stock is newer and larger, not because downtown homes are cheap to lease today. Put this page beside the housing pipeline numbers and the landlord’s question sharpens: demand is deepest in the core, supply is landing mostly in the suburbs, and Somerset is where the two collide. The census half of that picture is from 2021 and will not refresh until the City publishes new ward data, expected in 2028. Until then, this is the best ward-level map of where Ottawa’s renters actually are.
Frequently Asked Questions
How many Ottawa households rent?
147,030 of Ottawa’s 407,255 private households were renters in the 2021 Census, 36.1 percent. The figure comes from the Census long form, a 25 percent sample, published by ward in the City of Ottawa’s Open Data portal and retrieved October 26, 2026.
Which Ottawa ward has the most renters?
Somerset (Ward 14) leads on both measures: 75.3 percent of its households rent, and its 18,915 renter households are the most of any ward. Rideau-Vanier (Ward 12) is second at 72.7 percent and 18,005 renter households.
What is the median rent in Ottawa?
The 2021 Census put the median monthly shelter cost for rented dwellings at $1,380 (the average was $1,422). That is what tenant households reported paying in 2021 for the homes they already occupied, including utilities where the household pays them. It is not a current asking rent, and it should not be used to price a unit today.
Why are renter shelter costs highest in the suburbs?
Because of the stock, not the location premium. The rental homes in newer suburbs such as Stittsville (median $2,180) and Riverside South-Findlay Creek ($2,160) are mostly newer, larger houses and townhouses. The core’s rental stock is mostly older apartments, so Rideau-Vanier records the lowest median at $1,200 even though downtown asking rents for a new lease can be higher.
How current is this ward data?
It is the 2021 Census, the most recent census with a ward-level tenure split. The ward names and numbers are the 2022 to 2026 ward set; Ottawa’s wards change with the October 2026 election, and the City expects updated ward census data in 2028, after the 2026 Census.
Does this page show where new rental supply is being built?
No, and no Ottawa open data series can. Building permits do not record whether a new home will be rented or owned, so the supply side is tracked separately, without a tenure split, on our Ottawa housing pipeline page. This page shows where renters lived in 2021; the pipeline page shows where new homes are being permitted now.
Buying or Holding a Rental in a Ward You Don’t Know Well?
RentSetGo Property Management leases and manages rentals across Ottawa, from the majority-renter core wards to the suburban wards where rentals are scarce stock. We price each property against its own ward picture, the depth of the local renter pool, the shelter costs tenants there already carry, and the new supply permitted nearby, then handle the listing, tenant screening, leasing and day-to-day management from there.
Send us the address of the property you own or are considering. We will return a free rental appraisal for that property, with its ward’s renter share and census shelter-cost figures attached so you can see the tenant pool your rent has to work with.
613-800-2523 · info@rentsetgo.ca
BOOK A CALL GET A FREE RENTAL APPRAISAL
Managing rentals for local, out-of-province and non-resident owners across Ottawa, including the majority-renter core wards and the growth suburbs of Orléans, Barrhaven and Kanata.
Related Reading
- Ottawa Housing Pipeline: What’s Being Built, and Where
- How Much Rent Can You Charge in Ottawa? A 2026 Market Guide for Landlords
- How Much Does Property Management Cost in Ottawa?
- City of Ottawa Open Data: 2021 Long Form Census – Ward Data (official source)
- Ottawa Secondary Suites: The Quiet Supply Boom, in Numbers
- Ottawa Development Applications: The Front End of the Housing Pipeline
Data: City of Ottawa Open Data, 2021 Long Form Census – Ward Data and 2021 Short Form Census – Ward Data (Statistics Canada, 2021 Census, custom tabulation for ward areas, received by the City in November 2023), retrieved October 26, 2026; contains information licensed under the Open Government Licence – Ottawa. Tenure figures are from the long form, a 25 percent sample; census counts are randomly rounded, so ward figures sum to within 10 households of the city total. Shelter costs are census-reported monthly costs for tenant households in non-farm, non-reserve private dwellings in 2021. They are not asking rents or current market rents. The ward names and numbers are the 2022 to 2026 ward set. Permit figures quoted for comparison are from the City’s 2026 permits workbooks as compiled on the Ottawa housing pipeline page, retrieved October 25, 2026; permits record no tenure, and no rental share of new supply is estimated here. This page is general information about Ottawa’s rental market, not legal, tax, insurance or investment advice. Consult a licensed paralegal or lawyer, an accountant, or an insurance broker for advice on your own property.