
As of October 26, 2026, the City of Ottawa’s development applications system holds 1,569 distinct applications, spread across 3,450 municipal addresses. Site plan control applications and zoning by-law amendments account for four of every five of them. RentSetGo Property Management publishes this page from the City of Ottawa’s Development Applications open data layer, using a snapshot retrieved October 26, 2026, and refreshes it quarterly.
This page is the front end of the story our Ottawa housing pipeline page tells. The pipeline page counts dwellings once approvals, building permits and construction exist on paper. This page counts what enters the system before any of that: the planning applications themselves. One discipline runs through every figure below. The applications layer carries no dwelling-unit counts, so this page counts applications, never homes. An application is intent. A permit is commitment.
For a landlord, the value is in the timing and the geography. What is entering the system in your ward now is the supply your rent will compete with years from now, and the stage an application has reached says more about when it might arrive than any headline about it being approved.
How many development applications are in Ottawa’s system?
The October 26, 2026 snapshot holds 1,569 distinct applications. The City maps each application at every municipal address it touches, 3,450 address points in this pull, and the largest single application touches 34 addresses. Every count on this page is de-duplicated to the application, so a project spanning a block counts once.
Two of the seven application types carry most of the system. Site plan control, the approval that settles a specific project’s layout and design, and zoning by-law amendments, which change what the zoning rules allow on a site, together make up four of every five applications in the layer.
| Application type | Applications | Share of all applications | Submitted in the last 12 months |
|---|---|---|---|
| Site Plan Control | 682 | 43.5% | 56 |
| Zoning By-law Amendment | 566 | 36.1% | 78 |
| Plan of Subdivision | 117 | 7.5% | 6 |
| Official Plan Amendment | 100 | 6.4% | 18 |
| Ontario Heritage Act | 70 | 4.5% | 15 |
| Plan of Condominium | 17 | 1.1% | 0 |
| Demolition Control | 17 | 1.1% | 3 |
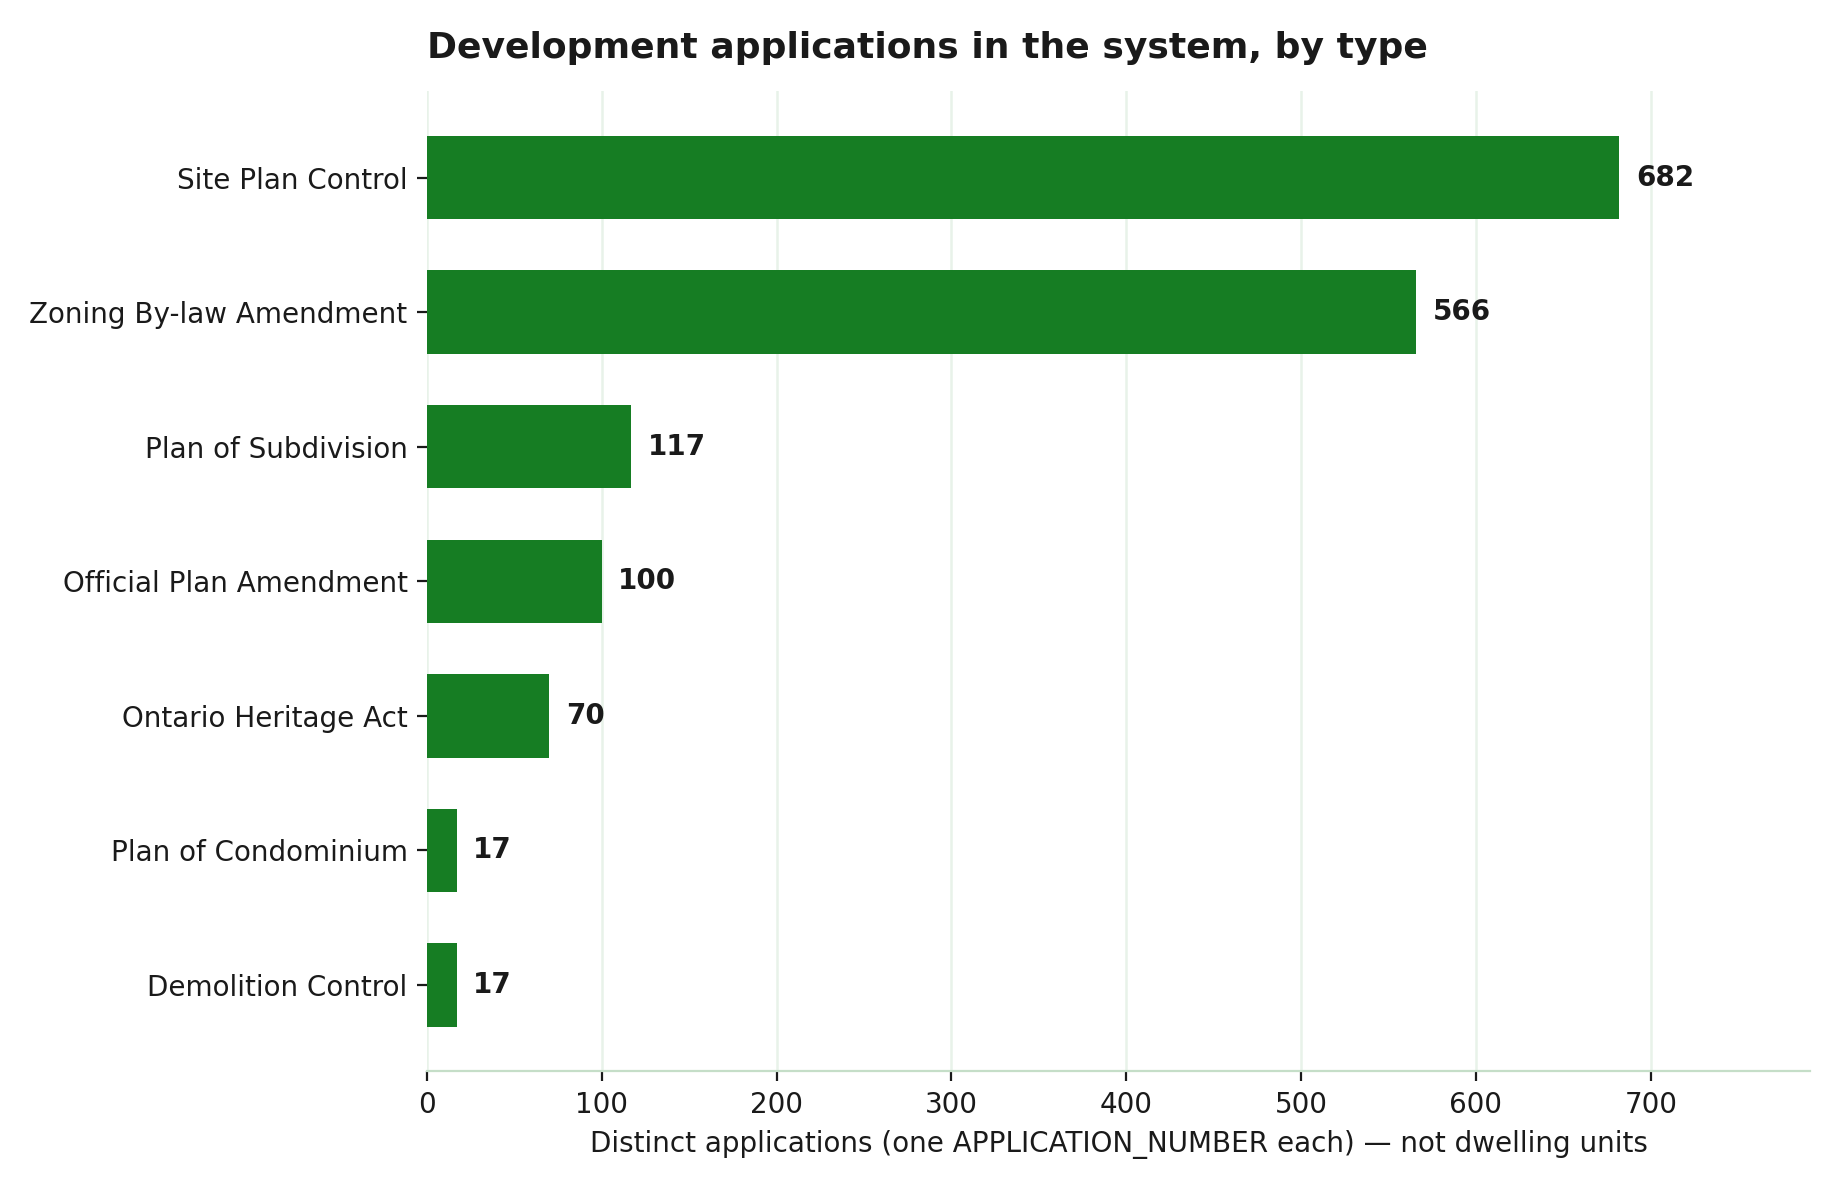
Distinct applications by type, snapshot of October 26, 2026. One application is counted once, however many addresses it touches. Source: City of Ottawa Open Data, Development Applications layer, retrieved October 26, 2026.
The rest of the system is smaller and more specialized. Plans of subdivision divide land into new lots and blocks. Official plan amendments change the City’s planning policy for a site or an area. Ontario Heritage Act applications cover work on designated heritage properties. Plans of condominium and demolition control files are rare, at 17 of each.
What stage are Ottawa’s development applications at?
Every application carries a status in the City’s system, recorded in about 70 legacy labels, some of them dating from the Ontario Municipal Board era. We grouped those labels into four stages, plus a small unbucketed remainder, and the grouping is ours, not the City’s.
| Stage (our classification) | Applications | Share of all applications |
|---|---|---|
| Approved / decision issued | 649 | 41.4% |
| In review / circulation | 434 | 27.7% |
| Agreement / legal tail | 431 | 27.5% |
| Dead ends | 53 | 3.4% |
| Unbucketed | 2 | 0.1% |
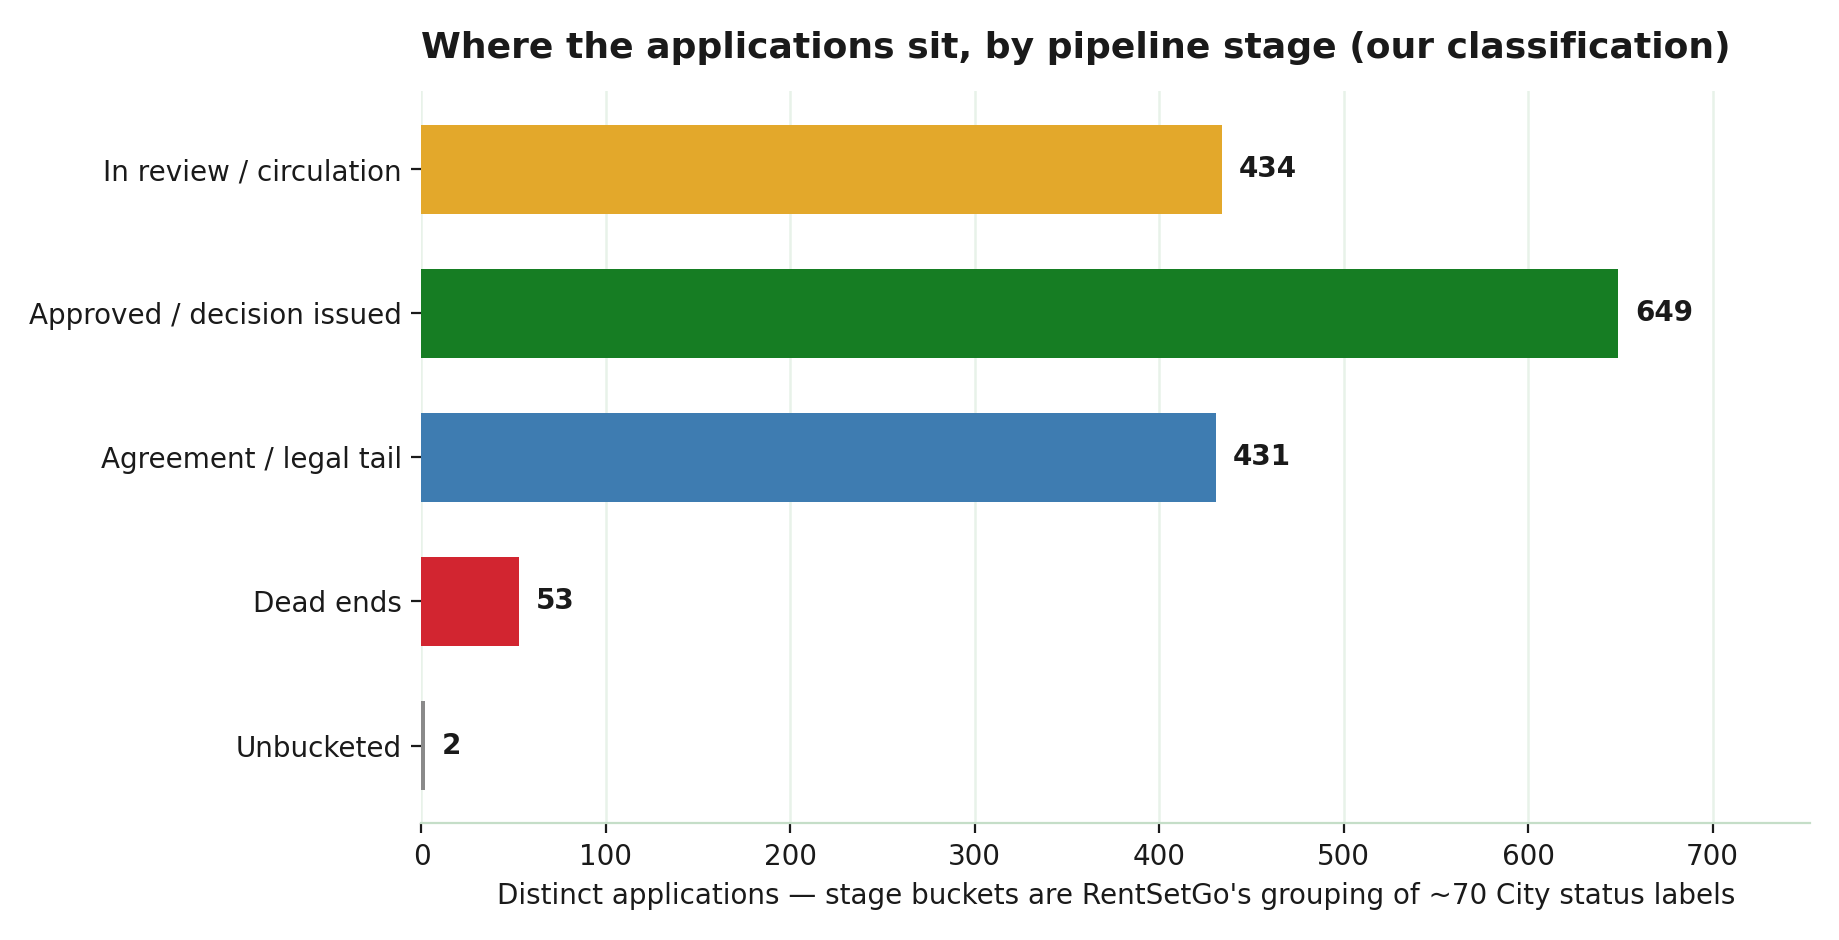
Distinct applications by stage, snapshot of October 26, 2026. Stage buckets are RentSetGo’s classification of the City’s status labels. Two applications carry legacy “CWN” labels we could not classify and are shown as unbucketed rather than guessed. Source: City of Ottawa Open Data, Development Applications layer, retrieved October 26, 2026.
Start with the group that has a decision. 649 applications, 41.4 percent, are approved or decided, and the single largest status in the whole layer sits here: 399 applications whose zoning by-law is recorded as in effect. Another 434, 27.7 percent, are still in review or circulation, circulating to agencies, out for comment, or in a tribunal process that has not produced a decision.
Then there is the tail. 431 applications, 27.5 percent, already have their decision but sit in the agreement stage, where site plan and subdivision agreements are prepared, signed, registered and held against securities. The largest label in that group, agreement registered with final legal clearance given, covers 173 applications on its own. The tail is nearly as heavy as the review queue in front of it, and that is the most useful thing on this page for a landlord to understand: in Ottawa’s system, “approved” and “about to be built” are different statements, often years apart.
Dead ends are a small group in the snapshot: 53 applications, 3.4 percent, made up of 38 whose approval lapsed with no building permit issued, 2 refusals and 13 files carrying no status at all. The section below explains why that count understates real fall-out. Two applications carry legacy “CWN” labels that nothing in the City’s data expands, so we report them as unbucketed rather than guess.
What this data can’t tell you
Three limits matter, and the first is the biggest. This layer has no dwelling-unit counts, no dwelling types and no tenure. It cannot say how many homes an application proposes, and applications vary enormously in size: one subdivision application can carry more homes than a dozen site plans. Application counts measure planning activity and direction. Housing volume lives on the housing pipeline page, which is built from approvals and permit files that do count dwellings.
Second, this is a snapshot of a live working set, not an archive. The City refreshes the layer about every three hours, and closed files thin out of it over time: only 84 address points remain for applications dated 2019, against 740 for 2021. Anything historical on this page is bounded by what the layer still holds, and the dead-end count in particular is a floor. Third, status dates in the layer include future-dated appeal and decision dates, so we did not use them as activity dates. The only dates behind these figures are application dates and the snapshot date itself.
One point in the pull, an address point with no application fields at all, is excluded from every application count. Source: City of Ottawa Development Applications layer (Open Ottawa), retrieved October 26, 2026. Contains information licensed under the Open Government Licence – Ottawa.
What came in over the last 12 months?
Intake is the flow, and the flow has slowed and changed shape. 176 distinct applications were submitted in the twelve months from October 26, 2025 to October 26, 2026, which is 11.2 percent of everything in the live set. The other 88.8 percent was already in the system before the year began, some of it for years: application dates in the layer reach back to November 2008.
The mix flipped against the standing stock. Site plan control is the largest type overall, but zoning by-law amendments led the year’s intake with 78 applications, 44.3 percent of everything submitted, ahead of site plan control at 56, or 31.8 percent. Together those two types made up 76.1 percent of intake. Official plan amendments contributed 18 applications and heritage applications 15. Plan of subdivision intake nearly stopped, at 6 applications all year, and not one plan of condominium was submitted.
Read the two facts together. What is entering the system is mostly project-by-project change inside the existing city, while the machinery is still working through a large stock of older files.
Which Ottawa wards have the most development applications?
Applications concentrate in the core and the inner wards. Ward 14, Somerset, leads with 133 applications, followed by Ward 12, Rideau-Vanier, at 119 and Ward 15, Kitchissippi, at 113. The top three wards hold 365 applications, 23.3 percent of the city total, and the top ten hold 957, or 61.0 percent. The lightest load in the city is Ward 24, Barrhaven East, with 21 applications. The address points column shows why every count on this page is de-duplicated: Ward 14’s 133 applications touch 347 addresses, the widest spread in the table.
| Ward | Applications | Share of all applications | Address points |
|---|---|---|---|
| Ward 14, Somerset | 133 | 8.5% | 347 |
| Ward 12, Rideau-Vanier | 119 | 7.6% | 286 |
| Ward 15, Kitchissippi | 113 | 7.2% | 304 |
| Ward 19, Orléans South-Navan | 104 | 6.6% | 233 |
| Ward 4, Kanata North | 103 | 6.6% | 169 |
| Ward 21, Rideau-Jock | 94 | 6.0% | 270 |
| Ward 6, Stittsville | 77 | 4.9% | 129 |
| Ward 13, Rideau-Rockcliffe | 73 | 4.7% | 151 |
| Ward 5, West Carleton-March | 72 | 4.6% | 145 |
| Ward 3, Barrhaven West | 69 | 4.4% | 157 |
Ward 12 takes in Sandy Hill and Lowertown, part of the area our Sandy Hill property management page serves. Owners there and in Somerset and Kitchissippi are the ones living beside the thickest file load in the city. Where those wards’ renters actually live is mapped on our Ottawa renters by ward page.
What This Means if You Own a Rental in Ottawa
The figures above are measurements from the City’s data. What follows is our reading of them for Ottawa landlords, labelled as interpretation throughout.
The front end is an infill front end
Six subdivision applications in a year, against zoning and site plan files making up 76.1 percent of intake, tells you the shape of what is coming. In our reading, new competition for Ottawa landlords will arrive project by project inside the existing city, a tower here, an intensified site there, rather than as whole new subdivisions landing at once. The caution cuts the other way too: applications are not units, and the six subdivision files could still carry more homes than a long list of site plans. Direction, yes. Volume, no. The suite-by-suite side of that infill is counted on our Ottawa secondary suites page.
Approved is not soon
431 applications have a decision and are still in the agreement tail, nearly matching the 434 still waiting for one. If a project near your rental is announced as approved, our reading is to treat its opening date as unknown until a building permit exists. The housing pipeline page is the check: an application becomes competition when it shows up there as permitted dwellings, not when it is approved here.
The pressure is concentrated in the core
Wards 14, 12 and 15 hold 23.3 percent of all applications between them. Owners in Somerset, Rideau-Vanier and Kitchissippi should expect the most construction disruption in the short run and the most new rental competition in the long run. Owners in low-file wards are watching a much thinner queue, and for them this page is mostly reassurance.
The dead-end share is a floor, not a rate
Only 53 applications in the snapshot read as lapsed, refused or status-less. Because closed files thin out of this layer over time, real fall-out is higher than any snapshot can show. Read the 3.4 percent as “at least this many”, never as a 96.6 percent success rate for applications near your property.
When this is a watch item, not an action item
Plenty of landlords can reasonably do nothing with this page. If your property is tenanted on a stable lease in a ward carrying few applications, the front end of the pipeline is background. Where it starts to matter is at a decision point: a purchase on a street with several active files, a renewal in a core ward, a unit coming empty while a large approved project works through its agreement stage nearby. That is where our property management service earns its fee, pricing and leasing against the local supply picture at both ends of the pipeline instead of the citywide average.
The Bottom Line
Ottawa’s planning system held 1,569 applications on October 26, 2026, and the shape of the system matters more than the total. Site plan control and zoning amendments are four of every five applications. 41.4 percent have a decision, but the 431 files in the agreement tail nearly equal the 434 still in review, so approval is a weak signal of timing. Intake has slowed to 176 applications in a year and flipped toward zoning-led infill, while subdivision applications nearly stopped. None of these counts is a count of homes. Read alongside the pipeline page, they tell you where development pressure is building and how far it still has to travel. This page is refreshed quarterly from archived snapshots of the City’s layer, and the figures above are the October 26, 2026 edition.
Frequently Asked Questions
How many development applications are active in Ottawa?
1,569 distinct applications, in the City of Ottawa’s Development Applications layer, snapshot of October 26, 2026, spread across 3,450 municipal addresses. Site Plan Control (682 applications) and Zoning By-law Amendments (566) make up four of every five. Every figure is a count of applications, because the layer carries no dwelling-unit counts.
What is the difference between a development application and a building permit?
A development application asks the City for planning permission: a zoning or official plan change, a subdivision or condominium plan, site plan approval, heritage permission or demolition control approval. A building permit is what authorizes construction itself, and it comes later. Our Ottawa housing pipeline page tracks the permit, starts and completions stages that follow.
Does this data show how many homes each application will build?
No. The City’s applications layer carries no dwelling-unit counts, no dwelling types and no tenure, so this page counts applications only. The counts measure planning activity and direction, not housing volume. One subdivision application can propose more homes than a dozen site plans.
Why do approved applications take so long to become buildings?
Because a decision is not the last step. In the October 26, 2026 snapshot, 431 applications, 27.5 percent, already had a decision but sat in the agreement stage, where agreements are prepared, signed, registered and secured. That legal tail is nearly as large as the 434 applications still in review, and only after it does a project move toward a building permit.
Which Ottawa wards have the most development applications?
Ward 14, Somerset (133 applications), Ward 12, Rideau-Vanier (119) and Ward 15, Kitchissippi (113). The top three wards hold 23.3 percent of all applications, and the top ten hold 957, or 61.0 percent.
How often is this page updated?
Quarterly. Each edition is built from a fresh snapshot of the City’s Development Applications layer, and the snapshot is archived so editions can be compared. The layer itself is a live working set the City refreshes about every three hours, and closed files thin out of it, so every figure is dated to its snapshot. This edition is the October 26, 2026 snapshot.
Own a Rental Where the Applications Are Piling Up?
RentSetGo Property Management leases and manages rentals across Ottawa. We track both ends of the supply picture, the applications entering the system on this page and the permits and completions on our housing pipeline page, then price and lease your property against what is actually coming in its ward rather than the citywide average.
Send us the address of the property you own or are considering. We will return a free rental appraisal for that property, with its ward’s development application activity attached, so you can see what your rent may be competing against.
613-800-2523 · info@rentsetgo.ca
BOOK A CALL GET A FREE RENTAL APPRAISAL
Managing rentals for local, out-of-province and non-resident owners across Ottawa, including the core wards where applications concentrate.
Related Reading
- Ottawa Housing Pipeline: What’s Being Built, and Where
- How Much Rent Can You Charge in Ottawa? A 2026 Market Guide for Landlords
- Bought an Ottawa New Build From Out of Province? What a Property Manager Handles
- Adding Secondary Dwelling Units in Ottawa
- City of Ottawa Development Application Search Tool (official source)
- Ottawa Secondary Suites: The Quiet Supply Boom, in Numbers
- Ottawa Renters by Ward: Where the City’s Renters Live
Data: City of Ottawa Open Data, Development Applications layer, snapshot retrieved October 26, 2026; contains information licensed under the Open Government Licence – Ottawa. All counts are distinct applications, de-duplicated by application number across the addresses each application touches; the source layer publishes no dwelling-unit counts, dwelling types or tenure, and none is estimated here. Stage groupings are RentSetGo’s classification of the City’s status labels; two applications could not be classified and are shown as unbucketed. The layer is a live working set that the City refreshes about every three hours, and closed files thin out of it over time, so figures describe the October 26, 2026 snapshot and will change between editions. This page is general information about Ottawa development activity, not legal, planning, tax or investment advice. Consult a licensed paralegal or lawyer, a planner, or an accountant for advice on your own property.