
Ottawa’s building permits added up to 127,342 net new homes between July 2011 and September 2026, according to the City of Ottawa’s own permit files, retrieved October 26, 2026. The volume is only half the story. In 2012, apartments were about a third of the net new homes the city permitted. In 2025, they were almost two thirds, and the detached single had fallen to about one home in eight. RentSetGo Property Management built this page from the City’s Construction, Demolition, and Pool Permits workbooks, the same open data series behind our Ottawa housing pipeline page, and it covers the full run of the series: fifteen years, every ward, every building type.
Why should a landlord care about permits issued in 2013? Because the stock competing for your next tenant was permitted years before it was built. The mix shift in these files is the reason a new one-bedroom apartment is now the most common new rental competitor in Ottawa, and why suburban townhouse owners increasingly compete with brand new rows on the next street. What a specific home can charge is covered in our guide to how much rent you can charge in Ottawa. This page covers the fifteen-year supply record behind those rents.
How many homes has Ottawa permitted since 2011?
The short answer is 127,342 net new dwelling units: 132,293 units added on permits and 4,951 removed, mostly through demolition permits, between July 2011 and September 2026. The fourteen full years from 2012 to 2025 total 116,053 net units, an average of about 8,290 a year. The pace was uneven. The strongest years were 2022 (12,317 net units) and 2020 (12,146). The weakest full year was 2015, at 4,592, when a slow apartment year pulled the total down even though singles had one of their better years of the decade.
| Year | Net new units | Units added | Units removed | Declared value, all permits |
|---|---|---|---|---|
| 2011 (Jul to Dec) | 3,461 | 3,605 | -144 | $0.95B |
| 2012 | 6,264 | 6,569 | -305 | $2.05B |
| 2013 | 6,419 | 6,653 | -234 | $2.39B |
| 2014 | 7,364 | 7,679 | -315 | $2.69B |
| 2015 | 4,592 | 4,871 | -279 | $2.14B |
| 2016 | 6,885 | 7,229 | -344 | $2.62B |
| 2017 | 6,293 | 6,624 | -331 | $2.69B |
| 2018 | 7,401 | 7,846 | -445 | $2.97B |
| 2019 | 9,113 | 9,604 | -491 | $3.16B |
| 2020 | 12,146 | 12,444 | -298 | $3.81B |
| 2021 | 9,685 | 10,032 | -347 | $3.86B |
| 2022 | 12,317 | 12,589 | -272 | $3.35B |
| 2023 | 7,936 | 8,191 | -255 | $3.09B |
| 2024 | 10,356 | 10,674 | -318 | $3.20B |
| 2025 | 9,282 | 9,592 | -310 | $3.19B |
| 2026 (Jan to Sep) | 7,828 | 8,091 | -263 | $3.19B |
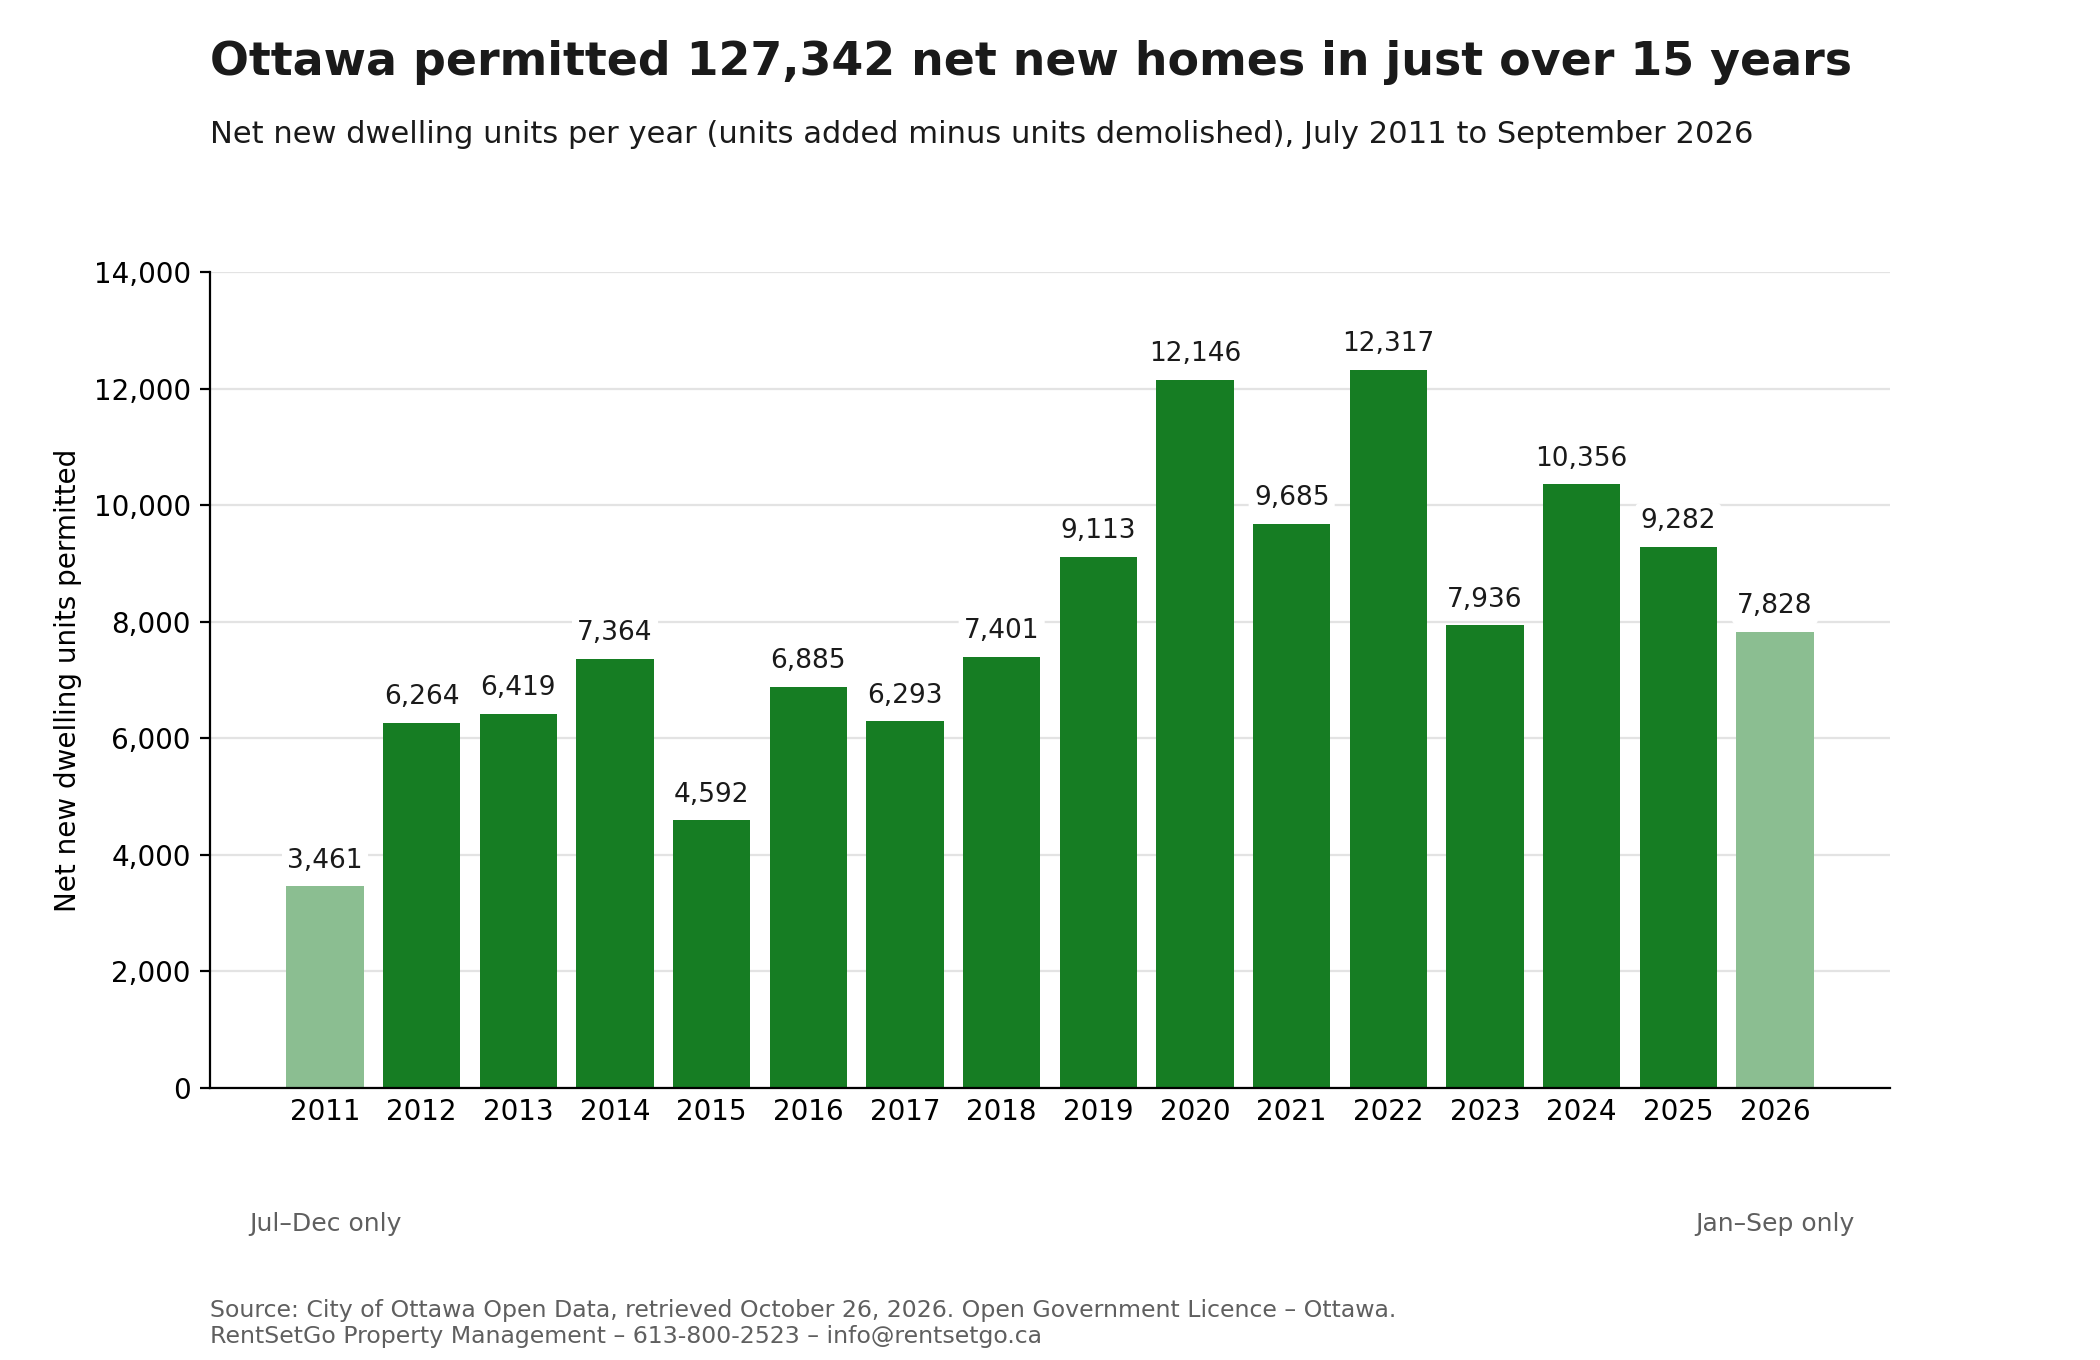
Net new dwelling units permitted per year. 2011 covers July to December and 2026 covers January to September. Source: City of Ottawa Open Data, Construction, Demolition, and Pool Permits workbooks, retrieved October 26, 2026.
Two things stand out in the year table. The first is how late the surge arrived: Ottawa permitted more homes in the six years from 2020 to 2025 (61,722 net units) than in the eight full years from 2012 to 2019 (54,331). The second is that the declared construction value kept climbing even when unit counts dipped. Permits of all kinds carried $2.05 billion of declared value in 2012 and $3.86 billion in 2021, the peak year by value. Those values cover every permit type, offices and warehouses included, and they are the figures applicants declared, so read them as a workload measure rather than a housing total.
How did the mix of new Ottawa homes change?
It flipped. In the four years from 2012 to 2015, apartments took 30.7 percent of the net new units in homes, singles 28.5 percent and rowhouses, including stacked rows, 29.6 percent. Three forms, roughly equal shares. In the three years from 2023 to 2025, apartments took 54.7 percent, rowhouses held at 24.8 percent, and singles fell to 14.3 percent. Semi-detached homes shrank from 4.5 percent to 2.5 percent across the same span.
| Era | Apartment | Rowhouse (incl. stacked) | Single | Semi-detached | Duplex, coach house, mixed |
|---|---|---|---|---|---|
| 2012 to 2015 | 30.7% | 29.6% | 28.5% | 4.5% | 6.7% |
| 2016 to 2019 | 33.7% | 29.8% | 30.4% | 3.4% | 2.8% |
| 2020 to 2022 | 44.2% | 25.6% | 23.7% | 2.7% | 3.8% |
| 2023 to 2025 | 54.7% | 24.8% | 14.3% | 2.5% | 3.7% |
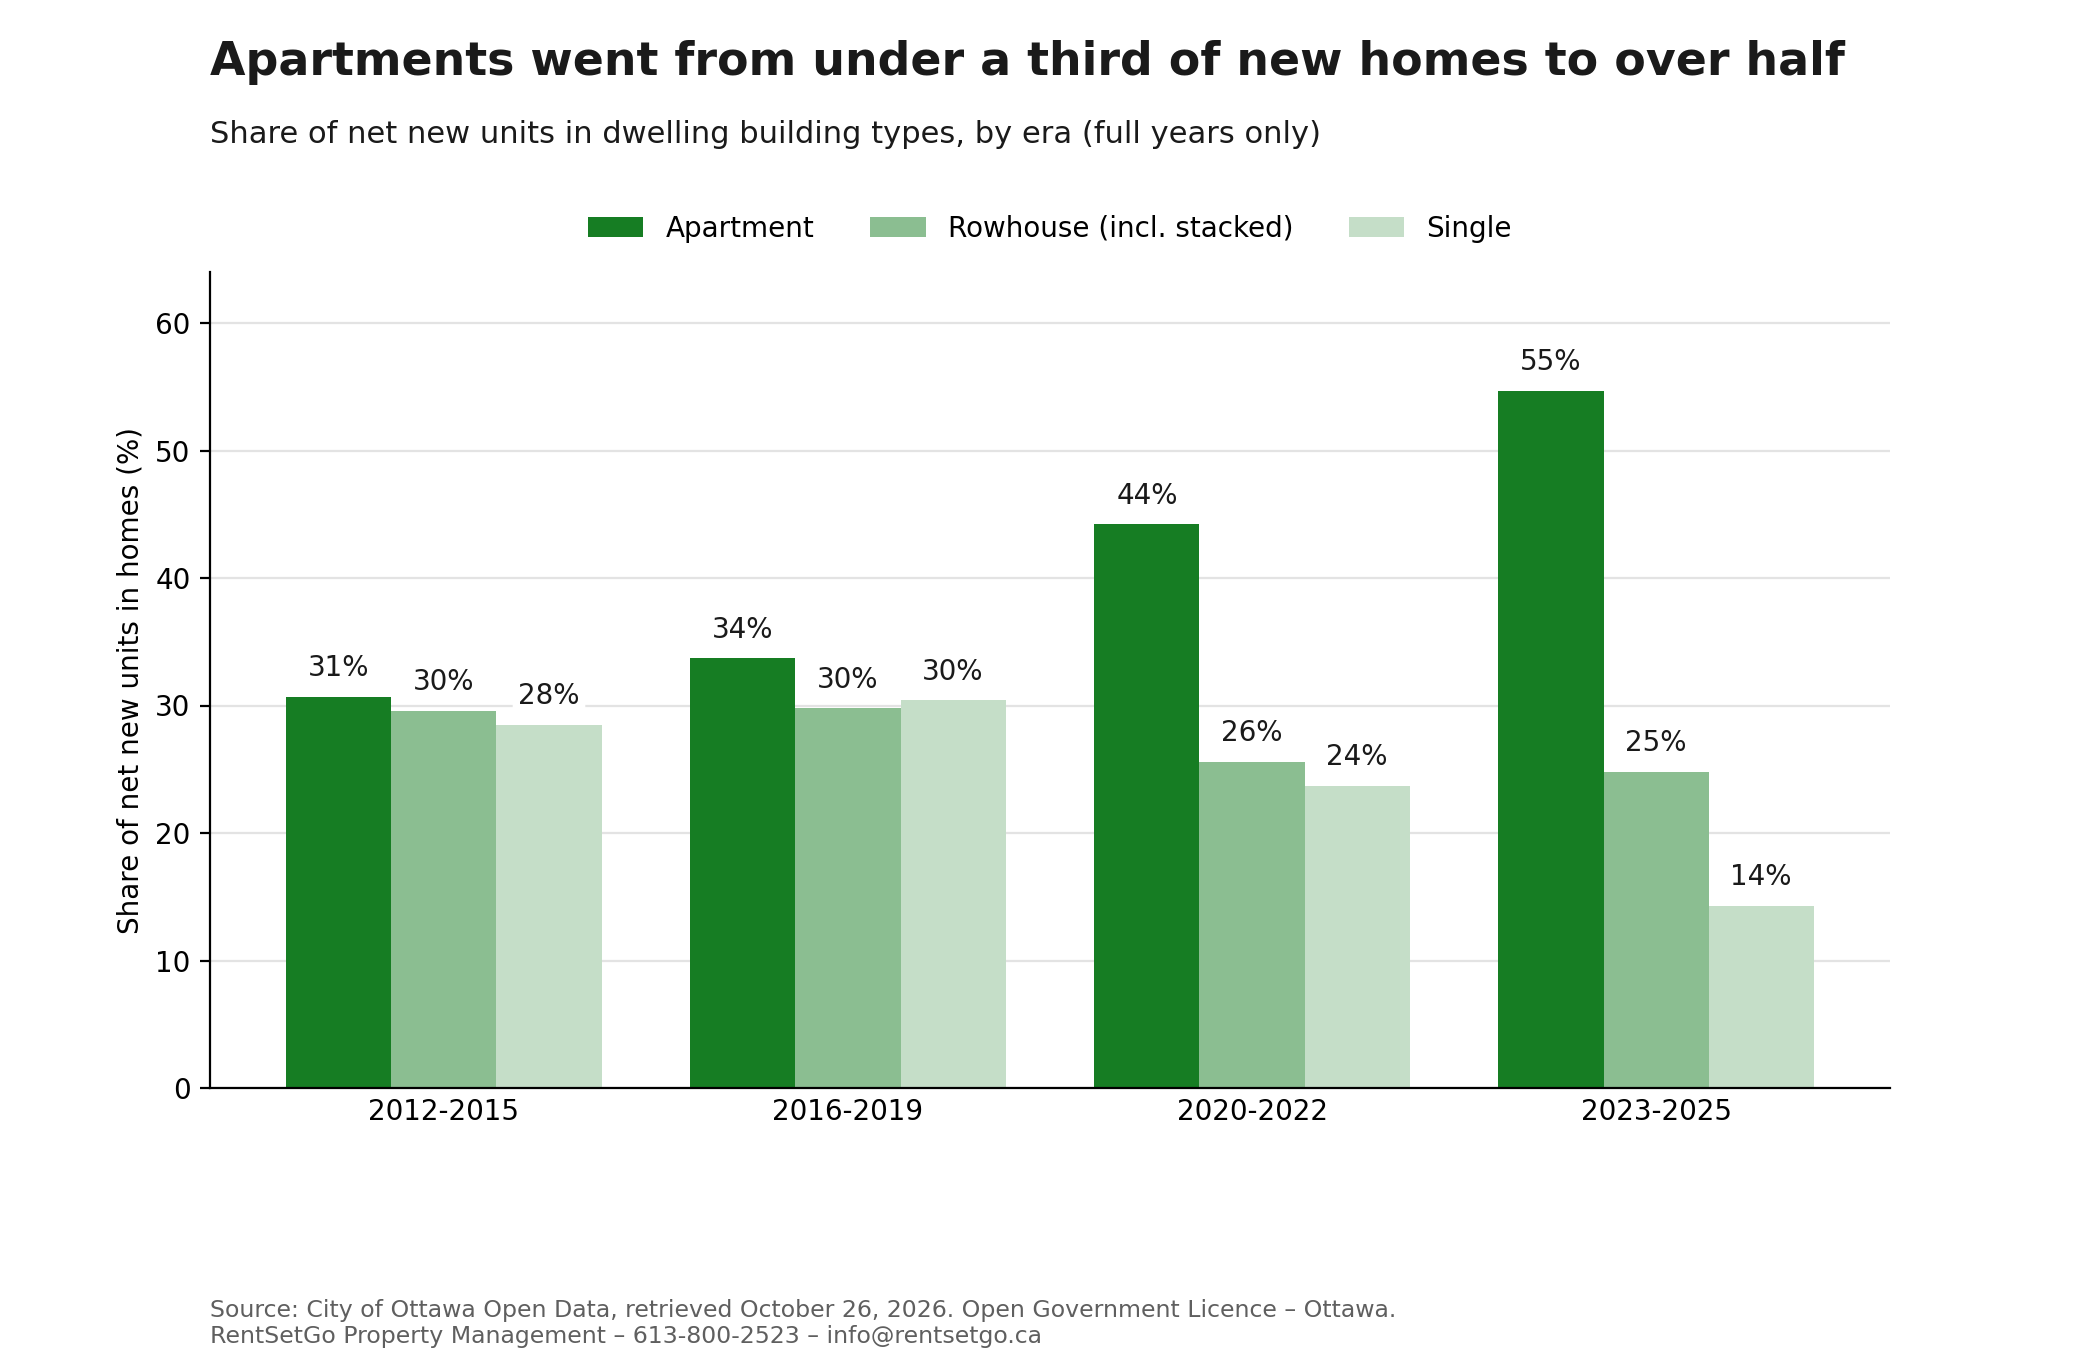
Share of net new units in dwelling building types, by era. Shares use the units recorded under dwelling building types as their denominator, so demolition permits and non-residential types sit outside this table. Source: City of Ottawa Open Data, permits workbooks, retrieved October 26, 2026.
The single-year figures are sharper than the era averages. In 2012, apartments were 32.9 percent of net new units in homes and singles 23.3 percent. In 2025, apartments were 63.5 percent and singles 12.2 percent. Across the whole period, apartments account for 52,125 of the net units, rowhouses and stacked rows for 35,606, and singles for 30,799. The rowhouse share is the quiet constant in the data: it never left the band between about 22 and 35 percent in any single year, which is why Ottawa’s suburbs kept adding ground-oriented rentals even as the apartment share climbed.
In the early 2010s, Ottawa’s new homes split three ways. By 2025, almost two of every three net new homes were apartments.
Which Ottawa wards added the most homes?
Start with a warning about ward numbers. Ottawa redrew its ward boundaries for the 2022 election and added a 24th ward, so a ward number in the 2014 file does not cover exactly the same ground as the same number in the 2024 file. The long-run table below uses the numbers as each year’s file recorded them. Treat it as a guide to where growth concentrated, not as a precise ranking. The second table is the clean one: 2022 to September 2026, all under the current boundaries.
Over the full period, the top of the table splits between downtown and the suburbs. Somerset ward, the downtown core, recorded 11,877 net new units, almost all of them apartments in large buildings. Barrhaven’s ward recorded 11,737 and Stittsville’s 11,705, built mostly as singles and rows on new subdivisions. Kitchissippi, the inner-west ward that takes in Westboro and Hintonburg, recorded 10,546, an intensification story rather than a greenfield one. Four very different kinds of growth, all within a few hundred units of each other at the top.
| Ward (number as recorded) | Net new units, Jul 2011 to Sep 2026 |
|---|---|
| Ward 14, Somerset | 11,877 |
| Ward 3, Barrhaven | 11,737 |
| Ward 6, Stittsville | 11,705 |
| Ward 22, Gloucester-South Nepean / Riverside South-Findlay Creek | 11,268 |
| Ward 15, Kitchissippi | 10,546 |
| Ward 19, Cumberland / Orléans South-Navan | 9,766 |
| Ward 4, Kanata North | 7,791 |
| Ward 12, Rideau-Vanier | 7,401 |
| Ward 21, Rideau-Goulbourn / Rideau-Jock | 7,286 |
| Ward 2, Innes / Orléans West-Innes | 4,565 |
Under the current boundaries, the recent ranking is tighter. Somerset still leads, with 4,620 net units from 2022 to September 2026. Behind it, four wards sit within 134 units of each other: Orléans South-Navan (4,143), Kanata North (4,025), Stittsville (4,012) and Barrhaven West (4,009), with Kitchissippi close behind at 3,997. The citywide total for those five calendar years is 47,719 net units, 2026 being a nine-month figure. Our Barrhaven, Kanata, Orléans and Stittsville pages track what that growth means street by street.
| Ward (current boundaries) | Net new units, 2022 to Sep 2026 |
|---|---|
| Ward 14, Somerset | 4,620 |
| Ward 19, Orléans South-Navan | 4,143 |
| Ward 4, Kanata North | 4,025 |
| Ward 6, Stittsville | 4,012 |
| Ward 3, Barrhaven West | 4,009 |
| Ward 15, Kitchissippi | 3,997 |
| Ward 12, Rideau-Vanier | 3,005 |
| Ward 21, Rideau-Jock | 2,741 |
| Ward 22, Riverside South-Findlay Creek | 2,656 |
| Ward 11, Beacon Hill-Cyrville | 2,086 |
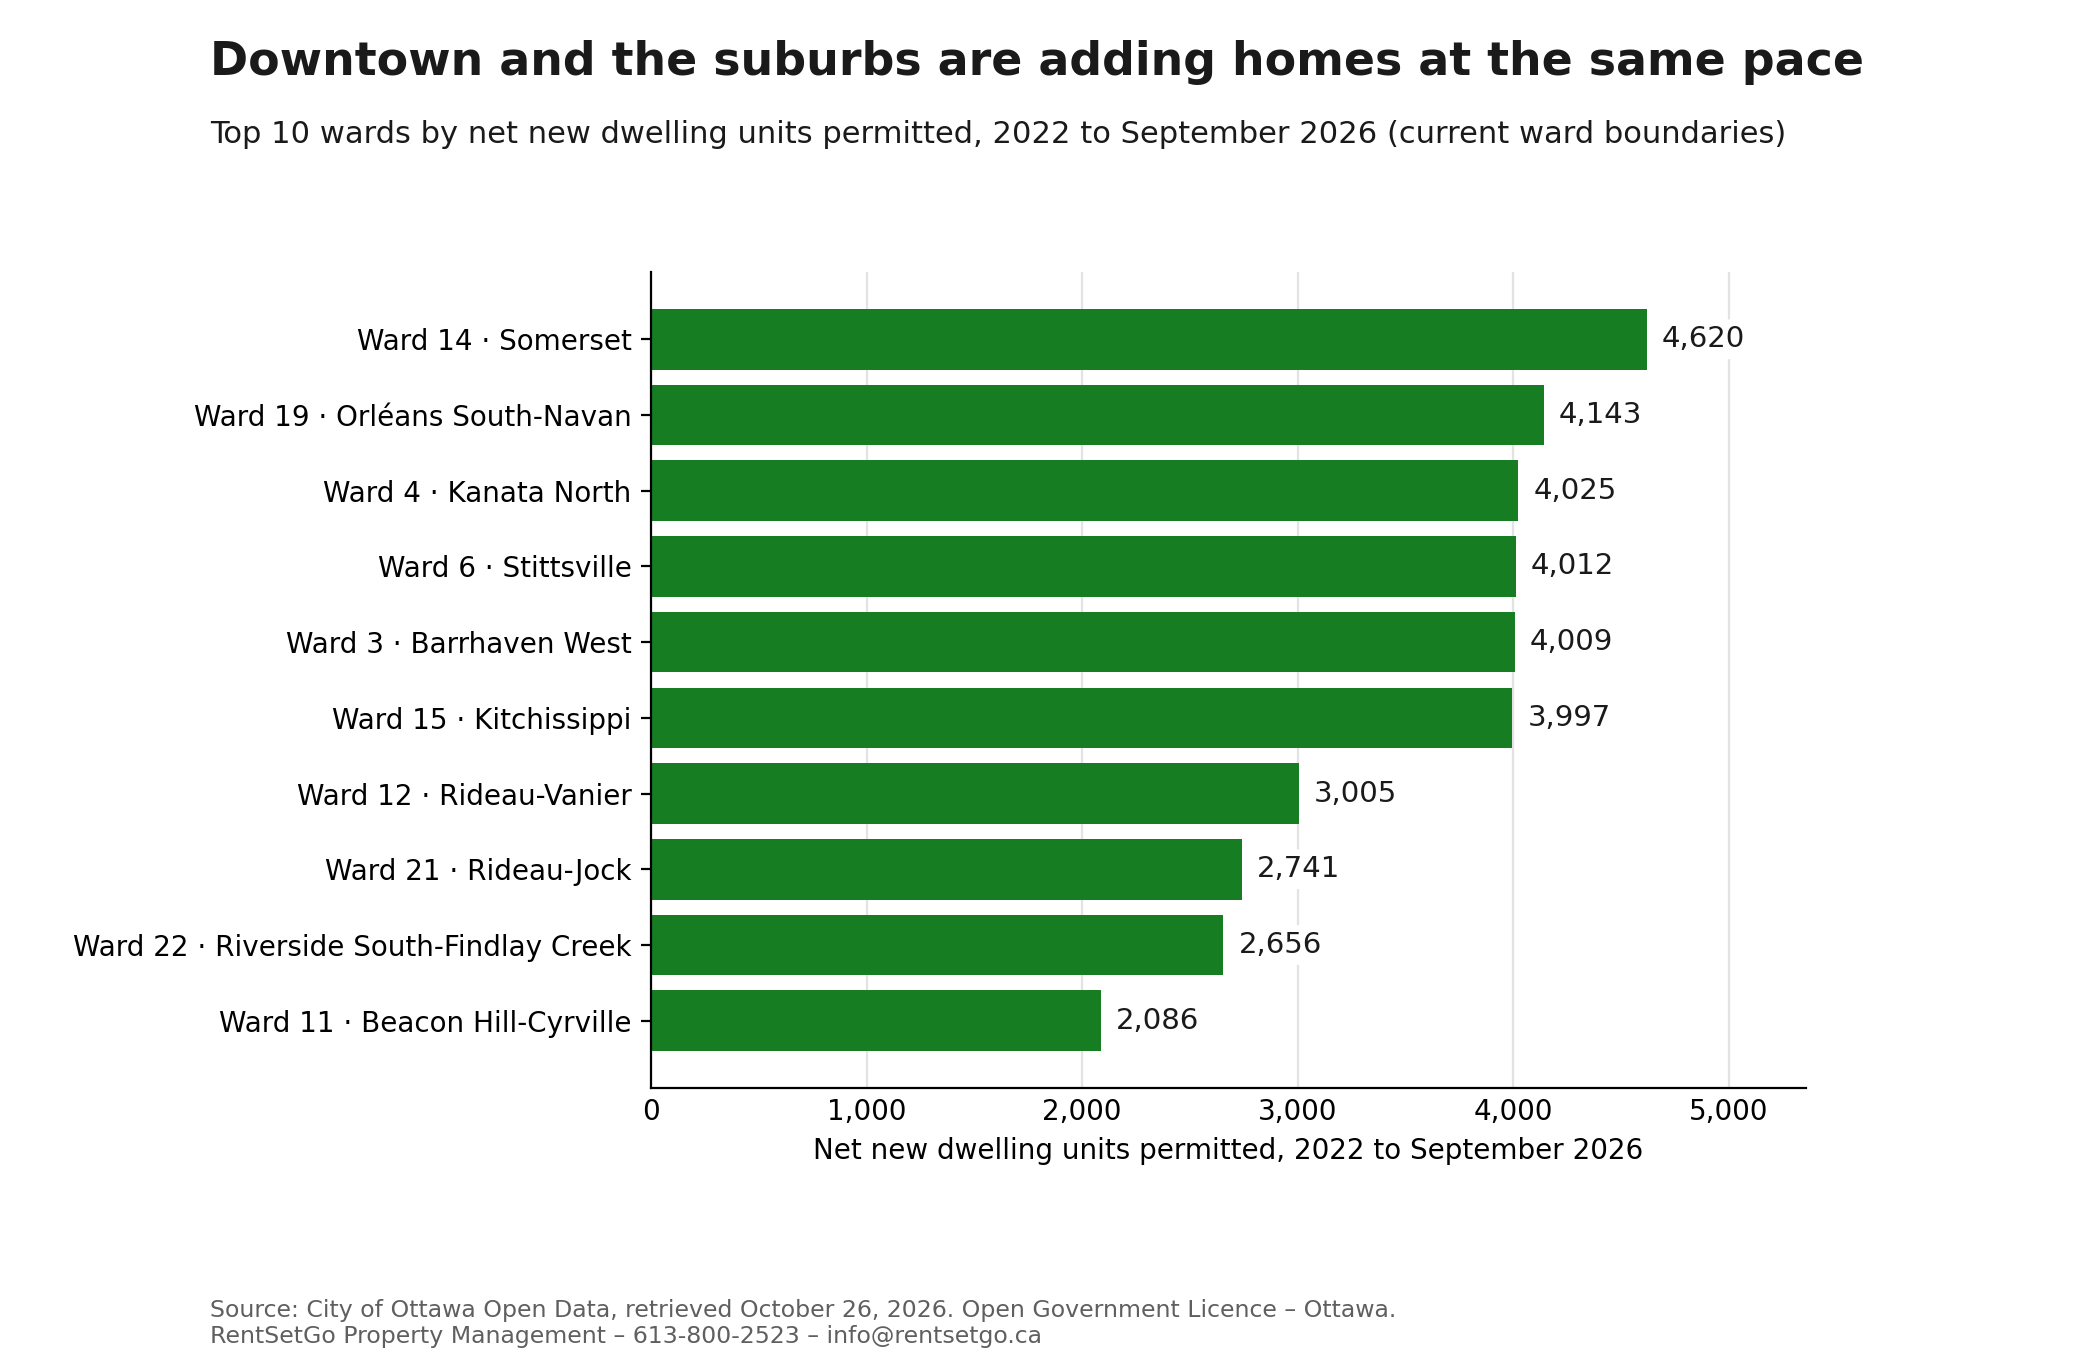
Top 10 wards by net new dwelling units permitted, 2022 to September 2026, current ward boundaries. Source: City of Ottawa Open Data, permits workbooks, retrieved October 26, 2026.
The demand side of those same wards is a separate count. Our Ottawa renters by ward page sets out where renter households already live, and the gap between the two tables is worth a look before you buy: some wards adding the most homes already have deep renter demand, and some are adding ownership product into neighbourhoods where renting is still thin.
What this data can’t tell you
Four limits matter, and this page would rather state them than let a clean chart imply otherwise.
A permit is not a finished home. A permitted project can be revised, delayed, phased or abandoned. Large projects are often permitted in stages, foundation first, and the unit count rides on the early permit. The figures here measure permission to build, which is why our housing pipeline page tracks starts and completions separately for the recent years.
There is no rental split. The permit files record building type and unit counts. They say nothing about whether a finished unit will be rented, sold as a condominium, or held by its builder. Any exact claim about how many of these 127,342 homes became rentals goes beyond the data.
The early files repeat themselves. In the workbooks up to 2022, and in the 2023 and early 2024 sheets, one permit appears on several address rows with its project totals repeated on each row. Counted naively, 2023 alone would show 20,934 units instead of 7,936. Every figure on this page counts each permit once for those years. The method was checked against the summary sheets the City prints inside the same workbooks: every year from 2012 to 2022 lands within 0.81 percent of the City’s own total, and two years match it exactly. The full reconciliation is published with our working files and summarized in the disclaimer below.
Declared values are not costs, and prices changed. The value column is what the applicant declared when the permit was issued, across all permit types. Nothing on this page adjusts for inflation, so a 2013 dollar and a 2025 dollar sit side by side in the totals. That is fine for comparing the scale of construction activity. It is not a price index.
What This Means if You Own a Rental in Ottawa
The figures above are measurements. What follows is our reading of them for Ottawa landlords, labelled as interpretation throughout.
Your competition changed shape as it grew
A landlord who bought in 2013 competed mostly with other houses and small buildings. The permit record says the marginal new competitor is now an apartment unit: 54.7 percent of net new homes in the 2023 to 2025 era, and 63.5 percent in 2025 alone. In our reading, that hits condo-unit landlords first, because a brand new purpose-built building offers the same tenant a newer unit in the same search results, often with amenities a single condo cannot match.
Ground-oriented rentals got scarcer at the margin
Singles fell from 28.5 percent of net new homes in the early 2010s to 14.3 percent in 2023 to 2025. Rowhouses held their share, around a quarter of new homes. We read that as support for well kept suburban houses and rows: the city is still adding them, but the flood is elsewhere. An owner of a detached rental in an established neighbourhood owns the form factor the permit data says is being added slowest.
Ward totals beat city averages at decision time
Fifteen years of permits landed unevenly. Somerset, Barrhaven, Stittsville and the old Gloucester-South Nepean ward each recorded more than 11,000 net units, while several established wards recorded fewer than 2,500 across the same fifteen years. If you are choosing between two properties, the ward’s fifteen-year habit of adding supply, and its last five years especially, tells you more than any citywide average. The same logic runs the other way at renewal time: a ward adding little new stock gives an existing landlord a quieter market.
When reading permits is enough on its own
Plenty of owners can stop at this page. If your property is tenanted, your ward is not near the top of either table, and you are not buying or selling this year, the permit record is background. The City publishes the underlying files free, and our pipeline page refreshes the recent end of the series quarterly. Where the fifteen-year picture starts to matter is at a transaction: pricing a purchase against a ward’s incoming supply, timing a sale before a wave of completions, or deciding whether a new build closing in Barrhaven or Kanata will lease against hundreds of similar new units. That is the point where a ward-level appraisal earns its keep.
Buying the next one
For a new-build investor, the era table is the shopping list in reverse. The forms being added fastest, apartments and stacked rows, are the forms where a new purchase competes with the most identical new product. The forms being added slowest carry less incoming competition, and they are also the hardest to find. Our guide for owners buying an Ottawa new build from out of province works through the closing and first lease-up side, and our Ottawa secondary suites page covers the other end of the supply story, the suites being added inside existing houses.
The Bottom Line
Ottawa permitted 127,342 net new homes in just over fifteen years, and the city’s new housing changed shape while it grew. Apartments went from about a third of new homes to over half, singles fell to about one in seven, and rowhouses held a steady quarter. The growth landed in a short list of wards, downtown and suburban at once. For a landlord, the usable version of all this is local: check your ward’s recent permit pace and your building type’s share before you price, buy or sell. This page will be refreshed as the City extends the series, and the figures above are the October 26, 2026 retrieval.
Frequently Asked Questions
How many net new homes were permitted in Ottawa over the last fifteen years?
127,342 net new dwelling units from July 2011 to September 2026, from the City of Ottawa’s permit workbooks retrieved October 26, 2026. That is 132,293 units added and 4,951 removed, mostly demolitions. The fourteen full years, 2012 to 2025, account for 116,053 of the total.
What was Ottawa’s biggest year for building permits?
2022, with 12,317 net new units, followed by 2020 at 12,146. The weakest full year was 2015, at 4,592 net units. The first nine months of 2026 produced 7,828, already ahead of seven of the full years in the series.
When did apartments become the majority of Ottawa’s new homes?
On an era basis, apartments passed half of net new units in dwelling building types in the 2023 to 2025 era, at 54.7 percent. They had been 30.7 percent in 2012 to 2015 and 44.2 percent in 2020 to 2022. In the single year 2025, the apartment share reached 63.5 percent.
Which Ottawa wards added the most homes?
Under the current ward boundaries, from 2022 to September 2026: Somerset (4,620), Orléans South-Navan (4,143), Kanata North (4,025), Stittsville (4,012) and Barrhaven West (4,009). Ward boundaries were redrawn in 2022 and a 24th ward added, so ward totals from the earlier files are not directly comparable.
Is a building permit the same as a housing start?
No. A permit gives permission to build specific dwellings. A start is counted when construction actually begins, and a completion when the home is finished. Projects can be delayed or changed after permitting, so permit totals run ahead of what gets built in any given year.
How much construction value do the permits represent?
About $45.3 billion of declared construction value across all permit types from July 2011 to September 2026, rising from $2.05 billion in 2012 to a peak of $3.86 billion in 2021. Declared value is the figure recorded on the permit at application. It is not a final construction cost, and it is not adjusted for inflation.
Thinking of Buying, Selling or Repricing a Rental in a High-Growth Ward?
RentSetGo Property Management appraises Ottawa rentals against the supply picture this page tracks: fifteen years of permits in the property’s ward, the building types being added around it, and the completions still working through the pipeline. An appraisal built on that record reads very differently from one built on last year’s rent roll.
Send us the address of the property you own or are considering. We will return a free rental appraisal for that property, with its ward’s permit history attached so you can see the supply your rent will compete with.
613-800-2523 · info@rentsetgo.ca
BOOK A CALL GET A FREE RENTAL APPRAISAL
Managing rentals for local, out-of-province and non-resident owners across Ottawa, including growth wards such as Barrhaven, Kanata, Stittsville and Orléans.
Related Reading
- Ottawa Housing Pipeline: What’s Being Built, and Where
- Ottawa Secondary Suites: The Quiet Supply in the Permit Data
- Ottawa Renters by Ward: Where the City’s Tenants Live
- Ottawa Development Applications: What Is Proposed Near Your Rental
- How Much Rent Can You Charge in Ottawa? A 2026 Market Guide for Landlords
- Adding Secondary Dwelling Units in Ottawa
Data: City of Ottawa Open Data, Construction, Demolition, and Pool Permits workbooks (annual files, July 2011 to September 2026), retrieved October 26, 2026. Contains information licensed under the Open Government Licence – Ottawa. Unit figures are the files’ net dwelling unit column, counted once per permit number in the file generations that repeat a permit across address rows. Every year from 2012 to 2022 was reconciled against the summary sheets printed in the same workbooks and lands within 0.81 percent of the City’s own totals; the 2023 to 2026 figures match the verified totals published on our Ottawa housing pipeline page. Ward boundaries were redrawn in 2022, so long-run ward totals mix two boundary sets and are indicative only. Declared construction values are as recorded at permit application, cover all permit types, and are not adjusted for inflation. The permit files carry no rental versus ownership split, and none is estimated here. This page is general information about Ottawa housing supply, not legal, tax, insurance or investment advice. Consult a licensed paralegal or lawyer, an accountant, or an insurance broker for advice on your own property.